Perceptual Noise Reduction (PNR) is noise reduction done using a perceptual (non-linear) frequency scale. There are a variety of different scales to use, such as the currently most popular Mel scale, the fallen out of favor Bark scale, its replacement the Equivalent Rectangular Bandwidth (ERB) scale, the slightly more obscure Greenwood scale, and the musically important Octave and Third Octave scales. Here we will investigate the performance of the Mel scale and the Bark scale versus the standard linear frequency scale in the Oracle Spectral Subtraction Additive Noise Reduction Algorithm to see just what all the fuss is about.
Perceptual Scale Conversion
Generally, a perceptual scale is defined either as a bijective function of frequency or as a discrete binning of frequency or both. To convert using a continuous scaling, we need to first construct a filter bank. In practice, once the filter bank is constructed, we work the same way as in the discrete case. That is, we use the bank to discretize the linear frequency scale into N bins, and determine a set of coefficients that will be used to represent the information in the linear frequency scale in our new perceptual scale.
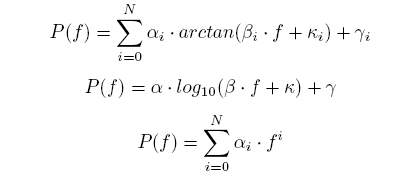
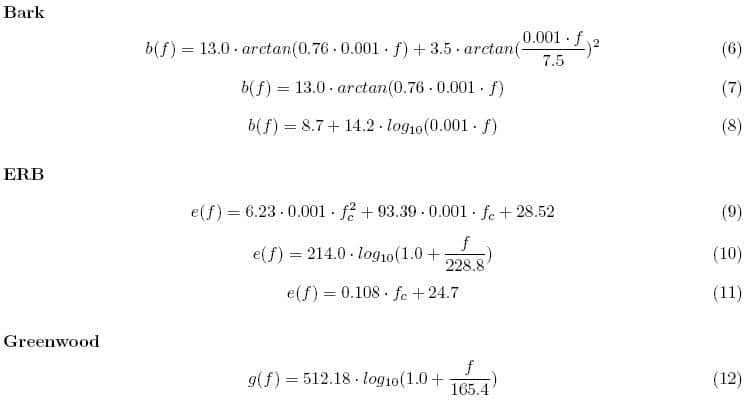
From the appendix, it is clear that all perceptual mappings have one or more of the following analytic forms:
All of these equations are clearly bijective on our range of interest, or at least their Taylor series are. Therefore, without loss of generality and to perceptual accuracy, we can use an arbitrary bijective perceptual mapping function P : ℝ → ℝ with arbitrary units of ‘peps’ denoted by p. To get started, we need to determine our maximum pep in order to determine the center frequencies of our filter bank. Given our sampling rate fs, we determine our Nyquist frequency to be fN = fs / 2
Therefore, pmax = P(fN). Given that we want M bins, the mth center frequency in Hertz is given by:
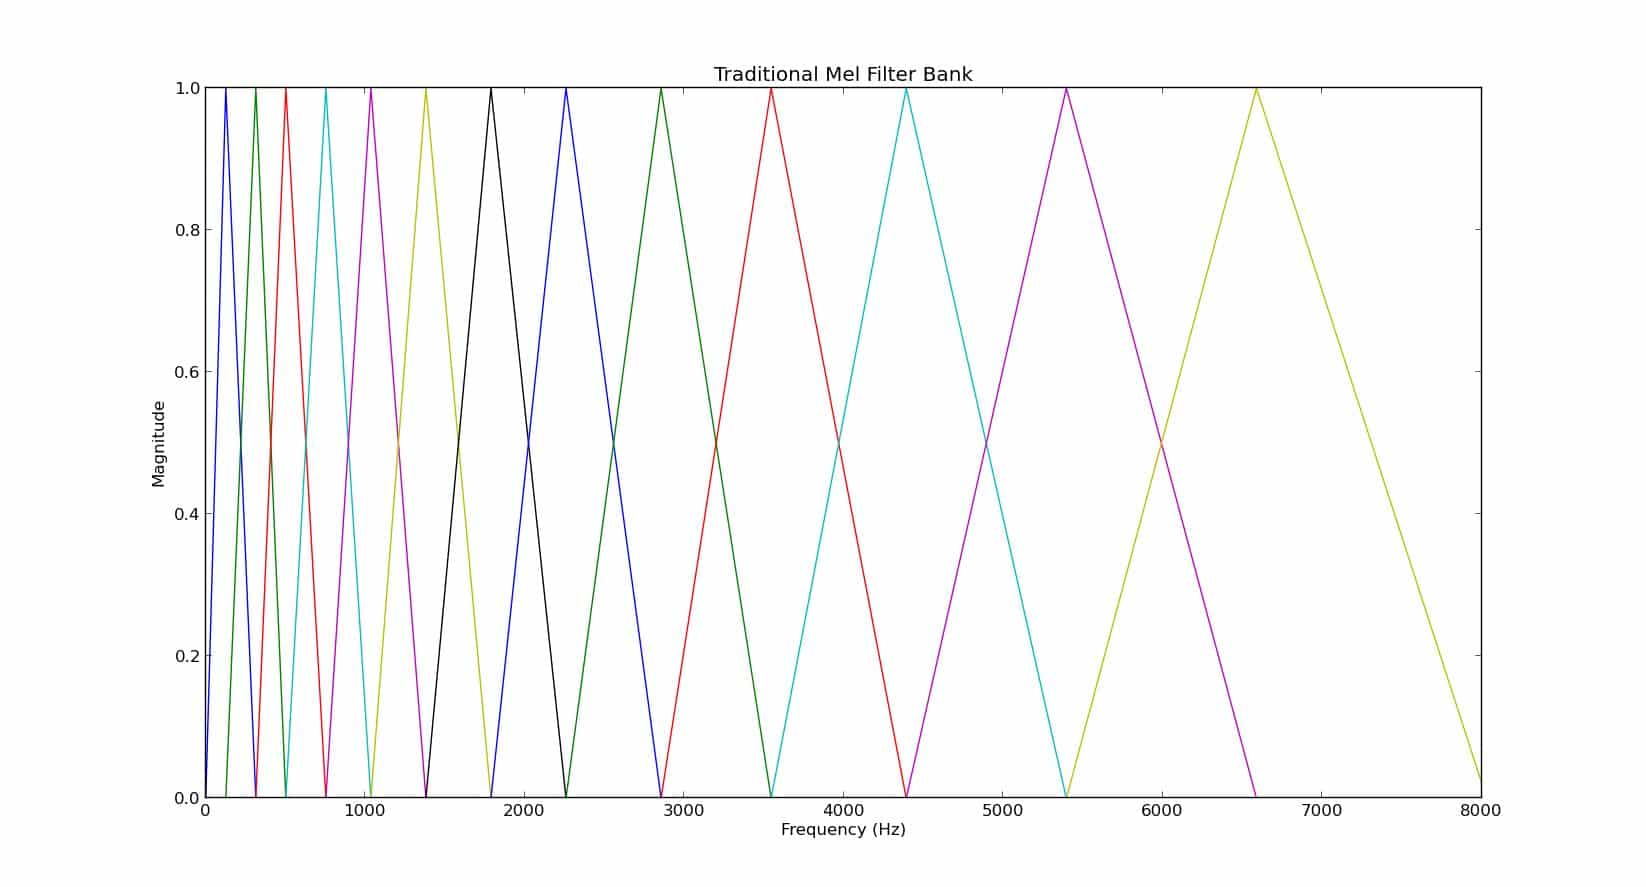
Now that we have our center frequencies, we need to choose a shape for our filters. In the mel scale tradition, a triangular window is used as the filter shape. The mth triangular window is defined as:
else
However, a triangular window is not the only option. In fact, you can use any shape you want (eg. Hamming, Gaussian, Nutall etc) as long as you select the overlap such that it forms a finite partition of unity with compact support over the Nyquist bandwidth. A finite partition of unity with compact support of a set A is a finite sequence of continuous functions W = {W1, W2,… WKg} Wi : ℝ → ℝ such that:
4. Each point of A has a neighborhood that intersects only finitely many of the ![]()
Where ![]() denotes the support of Wi. With this assured, you can avoid a filterbank altogether since if x is the incoming time domain frame, we can discretize the above and write:
denotes the support of Wi. With this assured, you can avoid a filterbank altogether since if x is the incoming time domain frame, we can discretize the above and write:
Where F is the Discrete Fourier Operator, X is the Discrete Fourier Transform (DFT) of x, and k is our discrete frequency index. The traditional mel triangular filterbank is not a partition of unity over the Nyquist bandwidth, but it is over a subset of it. If we let T represent the linear operator defined by W in our computer, we see that T is not unitary over the bands [0, fc1 ] and [fcM, fN] which leads to filterbank essentially removing the energy in these bands from the spectrum. This is easily shown below:
Figure 1: Traditional Mel Filter Bank
It is quite straightforward to append a half triangle to cover these two bands to partition the whole Nyquist bandwidth properly, however there is very little speech information in these two bands, so it is usually not an issue in practice. In fact, it has the benefit of largely attenuating the dreaded 60Hz hum and high frequency noise.
Once we have constructed this filterbank, we use it to discretize our perceptual scale. The pth coefficient of our new scale with be:
Where ℙ is the now singular discretized version of P, (∙|∙) is the standard inner product on ℝ, |X| is the magnitude spectrum of X, and X| denotes X restricted on its domain. Or we could use:
Either way, discretizing the mapping has lost injectivity but its surjectivity has remained. The preservation of surjectivity admits a hash between pep bins and frequency bins such that many standard noise reduction algorithms can still be employed except now using a perceptually motivated frequency domain spanning set. All of this seems like a lot of computation, but fortunately for us in using Short Time Fourier Transform (STFT) solutions, we already know the set of time domain and frequency domain frame lengths we will be using so this hash can be computed offline and loaded in an Abstract Data Type (ADT) for easy reference.
Perceptual Scales
In all of this general talk about perceptual scale conversion, where are the concrete examples? To satisfy this hunger, we will briefly touch on two scales given by very different representations. The Mel Scale is given by a continuous representation [1], while the Bark scale was originally defined only as discrete bins. In 1980, Zwicker published a few analytic approximations to the curve [2] which can be found in [3]. It should be noted that there has been more recent work that has approximated a continuous transformation for the Bark scale [4] in order to use it for digital audio with CD sampling rates.
The Mel Scale
The Mel Scale was derived experimentally in [1] and models the perceived magnitude of pitch, an inherently psychoacoustic phenomenon. To convert from frequency to mel, we use a bijective case:
The result is typically given the unit of ‘mel’ (m). This mapping is a scaled logarithmic representation of frequency. Its graph is shown below:
Figure 2: Frequency to Mel Mapping
From this mapping, the steps in the previous section can be employed to discretize this scale for perceptually based speech enhancement applications done in real time.
The Bark Scale
The Bark Scale was published in [2] and attempts to delineate the width of the average listener’s auditory critical bands. In [2], the Bark Scale is given only as a discrete binning of frequency, although a continuous curve was published but not fit numerically in the same paper. The published table is shown below:
Figure 3: The Bark Scale Table [2]
From the table, the coefficients of the Bark Scale can be thought of as being traditionally computed from non-overlapping rectangular windows instead of, for instance, the overlapping triangular windows traditionally in the Mel Scale. Using the analytic representations given in the appendix, we can now use any window shape and overlap we want, provided it meets the conditions prescribed here, potentially improving its utility in noise reduction. Here, we will again use the traditional definition. Its graph is shown below:
Figure 4: Frequency to Bark Mapping
A Quick Comparison
A quick comparison can be found in [5], along with some Matlab code to generate continuous versions of Mel, Bark, and ERB. The results are below:
Figure 5: Mel, Bark, and ERB Scale Comparison
As the figures show, Mel and Bark and ERB have very different normalized increment rates. Therefore, we expect different behavior from these scales when used in standard speech enhancement techniques. The question is, how is this behavior different, and is it different enough to be able to select which one is better?
A Semi-Oracle Noise Reduction Experiment
To get an idea of the ultimate utility of these scales in noise reduction, we propose a Semi-Oracle spectral oversubtraction experiment to remove additive white Gaussian noise. It is an Oracle technique because the noise is generated as a subroutine and added to a clean speech signal in the time domain to each frame, therefore we have complete access to all the statistics of the noise and clean signal. It is only Semi-Oracle because we chose to use only the noise magnitude and psd information, and not the clean phase information. This is to give an upper bound to the situation where we have very good estimation module for a magnitude based enhancement algorithm.
We chose Spectral Oversubstraction because it is a versatile technique suitable for real time processing, adaptable to other problems, and will easily show the effect of the non-uniform binning in the calculation of the Noisy Signal to Noise Ratio (NSNR) and application of the gain function.
Psuedo-code is shown below:
Listing 1: Noise Reduction Experiment
————————————–
1 for each frame
2 Generate Noise at J dB
3 Add Noise to frame in time domain to create a Noisy Frame
4 Calculate FFT of Noisy Frame and Noise Signal and save Noisy Frame Phase Data
5 Calculate Magnitude Spectrum of Noisy Frame and Noise
6 Calculate Narrowband NSNR via Linear Scale and via Perceptual Scale
7 Estimate Oversubtraction Factors
8 Create and Apply Gains
9 Reconstruct Frame
————————————–
In this experiment, the frame size was 32msec sampled at 16kHz with an overlap of 75%. The speech sample was “Screen the porch with woven straw mats”, a Harvard Sentence, taken from the 16k-LP7 TSP Speech database. Again, for reconstruction, the noisy phase was used as is, per usual with magnitude based enhancement algorithms. We will look at the results of using an FFT scale, the Mel scale, and the Bark scale at -10dB and 10dB SNR.
Results at -10dB
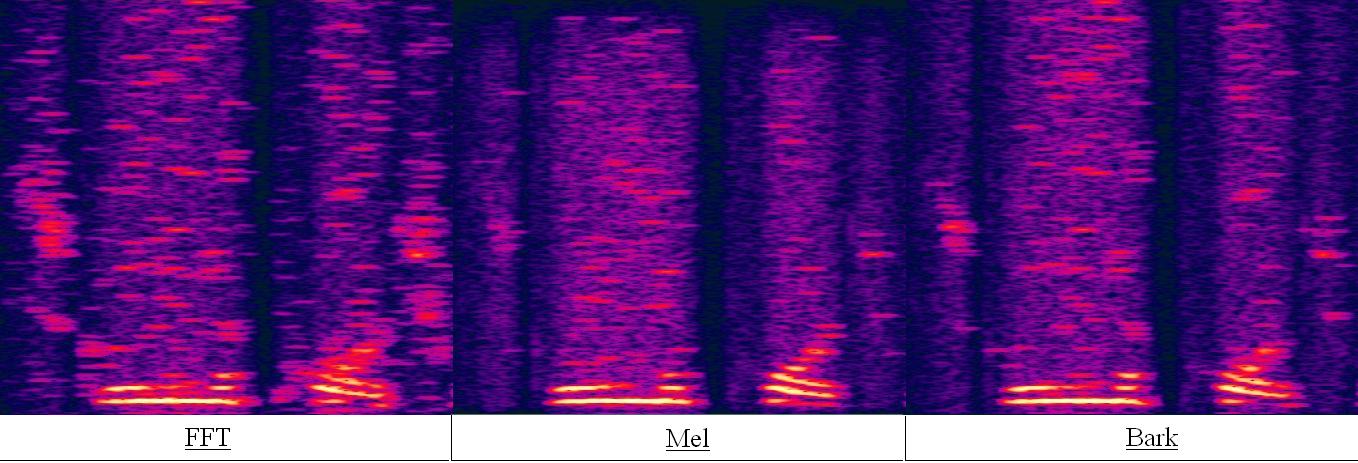
The results are shown for the phrase “Screen the porch” with additive noise at -10dB. The FFT result is on the left, the Mel result is in the middle, and the Bark result is on the right:
Figure 6: Results at -10dB: FFT – Mel – Bark
As the results show, there is much more musical noise for the FFT case. This is apparent in the random speckling of high energy short time strips found in the FFT spectrogram. The Mel result has much less musical noise, but there is more attenuation of the unvoiced sounds. However, the residual noise is more even in the Mel result than the FFT result. The Bark scale seems to be an intermediate of the two. Here, there is more musical noise than the Mel case, but less than the FFT. In addition, there is less attenuation of the unvoiced sounds than the Mel result, but more than the FFT.
Results at 10dB
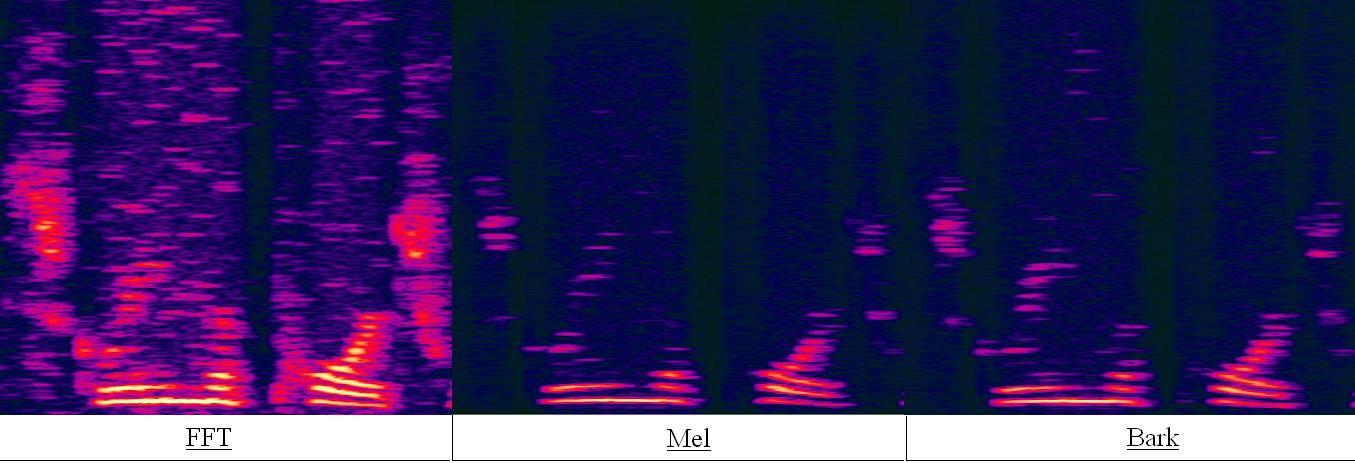
Figure 7: Results at 10dB: FFT – Mel – Bark
Here is where the Mel and Bark Scales really shine, and shows just how bad a simple Spectral Oversubtractor is as a noise reduction algorithm for the standard linear frequency scale. As you can see from the picture, the FFT result still has residual noise and is plagued by musical noise. The Mel and Bark results in contrast have virtually no musical noise and virtually no residual noise.
Conclusion
In this article we considered constructing a general perceptual scaling for speech enhancement in a computer. We examined two scales, the Mel and Bark, and compared them in a noise reduction experiment with the standard FFT. It seems that these perceptual scales may be the preferred scales to use, at least in magnitude based noise reduction algorithms. Further work will be concentrated on examining the performance using standard methods of noise statistic estimation, and comparing how using a discrete bin representation as given by [2] and applying the filterbank approach illustrated here using approximations in [3,4] effects performance.
NOTE: Appendix A contains some analytical approximations to various perceptual scales, and Appendix B contains a mapping from Bark Band to FFT Bin for a 32ms window sampled at 16Khz.
More Information
Appendix A: Some Analytic Approximations
Appendix B: Bins to Bark Band
Table 1: Bins To Bark Mapping: 32ms at 16Khz
Bark Band Start Bin End Bin Number of Bins
1 0 6 7
2 7 12 6
3 13 19 7
4 20 25 6
5 26 32 7
6 33 40 8
7 41 49 9
8 50 58 9
9 59 69 11
10 70 81 12
11 82 94 13
12 95 110 16
13 111 127 17
14 128 148 21
15 149 173 24
16 173 201 29
17 202 236 35
18 237 281 45
19 282 339 58
20 340 409 70
21 410 492 83
22 493 511 19
22 512 531 19
21 531 614 83
20 615 684 70
19 685 742 58
18 743 787 45
17 788 822 35
16 823 851 29
15 852 875 24
14 876 896 21
13 897 913 17
12 914 929 16
11 930 942 13
10 943 954 12
9 955 965 11
8 966 974 9
7 975 983 9
6 984 991 8
5 992 998 7
4 999 1004 6
3 1005 1011 7
2 1012 1017 6
1 1018 1023 6
References
[1] S. S. Stevens, J. Volkmann, and E. B. Newman, A Scale for the Measurement of the Psychological Magnitude Pitch, in J. Acoust. Soc. Am. Volume 8, Issue 3, pp. 185-190 (1937)
[2] E. Zwicker, Subdivision of the Audible Frequency Range into Critical Bands, in J. Acoust. Soc. Am. Volume 33, Issue 2, pp. 248 (1961)
[3] E. Zwicker, Analytical expressions for critical-band rate and critical bandwidth as a function of frequency, in J. Acoust. Soc. Am. Volume 68, Issue 5, pp. 1523-1525 (1980)
[4] , Julius O. Smith and III and Jonathan S. Abel, “Bark and ERB Bilinear Transforms”, IEEE Transactions on Speech and Audio Processing, November 1999
[5] Giampiero Salvi, “Auditory Scales” Internet: http : //www:speech:kth:se/giampi/auditoryscales/, Sept. 03, 2008 [June. 13, 2013].
