One technique for image feature extraction is the Scale Invariant Feature Transform (SIFT). Image features extracted by SIFT are stable over image translation, rotation and scaling, and somewhat invariant to changes in the illumination and camera viewpoint.
Major phases of the SIFT algorithm are: scale-space extrema detection, keypoint localization, orientation assignment, and keypoint generation.
The algorithm is based on the localization of points of interest. These points correspond to local extrema from a difference-of-Gaussian filter at different scales. A Gaussian-blurred image is:
L(y, x, σ) = G(y, x, σ) ∗ I(x, y)
Where I(y, x) is the input image and ![]() – is a variable-scale Gaussian filter.
– is a variable-scale Gaussian filter.
A Difference of Gaussian (DoG) image can be generated from the difference of two images, each with the Gaussian blurring filter applied at different levels:
D(y, x, σ, k) = L(y, x, k) − L(y, x, σ).
The difference-of-Gaussian filter provides an approximation to the Laplacian of Gaussian filter.
First, the Gaussian filter is applied to the original image at different scales. The scales are grouped by octaves where one octave corresponds to doubling the value of σ. Then a sequence of DoG images is generated from the difference between blurred images at adjacent levels.

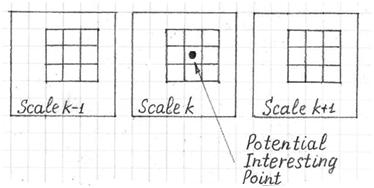
Next, the DoG images are searched for points of interest. Each pixel of each DoG image is compared to its surrounding 8 neighbors, and to the 9 pixels of both adjacent DoG images. The pixel is marked as a point of interest if it’s a local maximum or minimum. A more precise location for the point can be calculated by interpolation using neighboring pixels values.

Some points of interest may be eliminated if they have low contrast or are located on an edge. A point may be located on an edge if the gradient in one direction is much stronger than the gradient in the perpendicular direction.
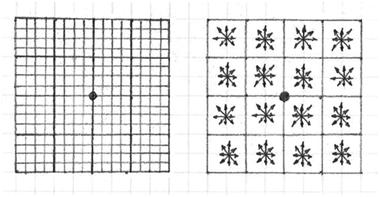
Next, for each point of interest, the dominant orientation is calculated. This is done by calculating the gradient angle for each pixel in a small neighborhood around the point of interest. Then a histogram is created using the angle of each gradient weighed by its magnitude. The dominant orientation is determined from the largest bin in the histogram.
Finally, objects can be classified from the set of points of interest using methods such as SVM (support vector machine), neural networks, etc.