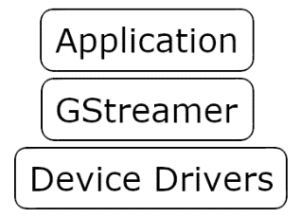
GStreamer is a cross-platform multimedia framework. It is an abstraction layer that sits between the user application and the low-level operating system APIs for audio and video hardware. With GStreamer, the application creates a pipeline composed of various connected elements. Elements can be sources, sinks or filters. Data flows from sources, through filters and into sinks. For two elements to be linked, both elements must agree on a data format for the link.
Figure 1: Software Stack for a GStreamer Application
In some applications, GStreamer pipelines can become difficult to manage. Each element must be configured and linked properly for the pipeline to function. This can be especially difficult for large pipelines that may be changed at run-time. GStreamer has a number of debugging tools available that are intended to help find and resolve problems in the pipeline. This article provides an overview of these tools, focusing on the Linux development environment.
This article will discuss three of GStreamer’s debugging tools: error codes, console prints and pipeline graphs. Error codes are returned by most of GStreamer’s API functions, and there are functions to receive error codes that are generated deeper in the pipeline at run-time. Console prints are generated by GStreamer objects. They are directed to the console, and can be controlled with environment variables. Pipeline graphs are text files that GStreamer can generate on command. They use a standard format and can be viewed as graphs by various applications.
Error Codes
The GStreamer library is written in C. Most of the API functions have return values that should be checked for errors. Functions returning pointers should have a NULL check. Functions returning other types might have certain values that represent errors, and those values should be checked. Proper error checking is the first debugging tool that should be used. The GStreamer API documentation is a good reference for this.
In addition to return values, GStreamer uses a message system for reporting errors at run-time. The user application can poll the pipeline for messages while it’s running. Messages have a type, and error is one of the types. Error messages include information about the error including which element generated it, and a string describing what happened.
Console Prints
GStreamer elements can generate prints directed to the console. Each print has a debug level which is a number describing how urgent and frequent the message is. Higher number prints are less urgent and more frequent. Lower debug levels should reveal common errors such as elements not connecting or negotiating media properly. Higher levels might be needed when debugging custom elements or trying to debug timing issues.
The console prints can be filtered using the environment variable GST_DEBUG. This variable is set to a number, and all prints with a debug level less than or equal to that number are let through. If the environment variable is unset, or set to zero, no console prints are generated. Higher level console prints can be very verbose, generating a lot of output. They can generate so much output that they degrade the performance of the application. Re-directing the console output to a file can help with this.
Pipeline Graphs
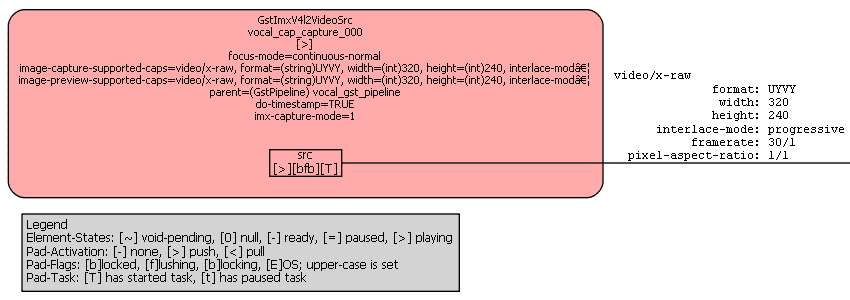
Sometimes the best way to find out the state of a pipeline is to get a picture of it. This is what pipeline graphs provide. They contain information about what elements exist, the configuration of those elements, how the elements are linked and the data format of each link. There are API functions in GStreamer that will cause it to generate a text file, using the graph description language, that shows the current state of the pipeline. Pipeline graphs will only be generated if the environment variable GST_DEBUG_DUMP_DOT_DIR is set. This variable should contain a folder where the graph file will be saved. The API function requires a filename, so if multiple graphs are needed, they must be given unique names.
One way to view the graph files is using the open-source software GraphViz. When developing for embedded systems it’s not always possible to run GraphViz on the target device, so copying the graph files to another machine may be necessary. The ‘scp’ command is good for this, if it’s available.
Figure 2: Example of a GStreamer pipeline graph

